Playing soccer on a scorching hot summer day may affect athletes’ physical performance and lead to exertional heat illness. Microclimates – human-level meteorological conditions modified by nearby manmade and natural objects – have been shown to be significantly impacted by differences between natural turfgrass (NT) and artificial turf (AT) (Francis, 2018; Jim, 2017; Guyer, 2020). But less attention has been paid to how athletes’ thermal sensation is affected between the two field types. Therefore, the purpose of this study was to compare Texas A&M University Men’s Club Soccer players’ thermal stress when competing on NT and AT fields. While quantifying objective and subjective thermal comfort, particular attention was given to determine differences in the players’ physiological and perceived thermal stress on each field type. Microclimate and questionnaire survey data were collected on each field type and from all players, respectively, over four summer days in September 2021. An energy budget model that can estimate human thermal comfort using energy flux theory was used to quantify their physiological thermal stress.
METHODS AND MATERIALS
Study site
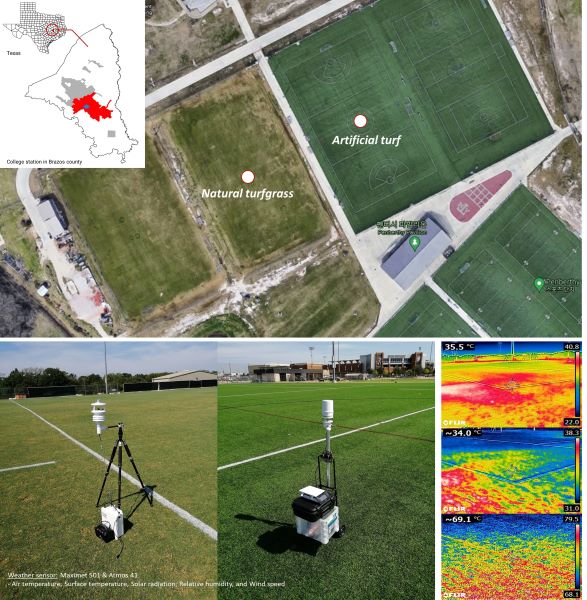
Two soccer fields at Penberthy Rec Sports Complex in College Station, Texas, were selected as sites for the study. According to the Köppen climate classification, College Station’s climate is considered Humid Subtropical Climate (Cfa), where the average daily high temperature between June and September is above 88.8°F.
Both soccer fields are managed by SSC Services for Education at Texas A&M University. The NT field was 105,000 ft2 and consisted of ‘Tifway 419’ hybrid bermudagrass on native soil, and the AT was 115,000 ft2 and consisted of Astroturf RootZone 3D3 Blend 52 that was installed in 2008 and had a blend of monofilament, slit film, and nylon “rootzone” fibers with crumb rubber infill. The area around the fields was wide open with no presence of natural or manmade objects nearby (e.g., buildings, water bodies, trees, and vehicle roads) that may potentially affect thermal conditions. The study area location, field layouts, photographs of the weather sensors used, and infrared thermal imagery taken from grass and turf are shown in Figure 1 (above).
Data collection
Microclimate measurement
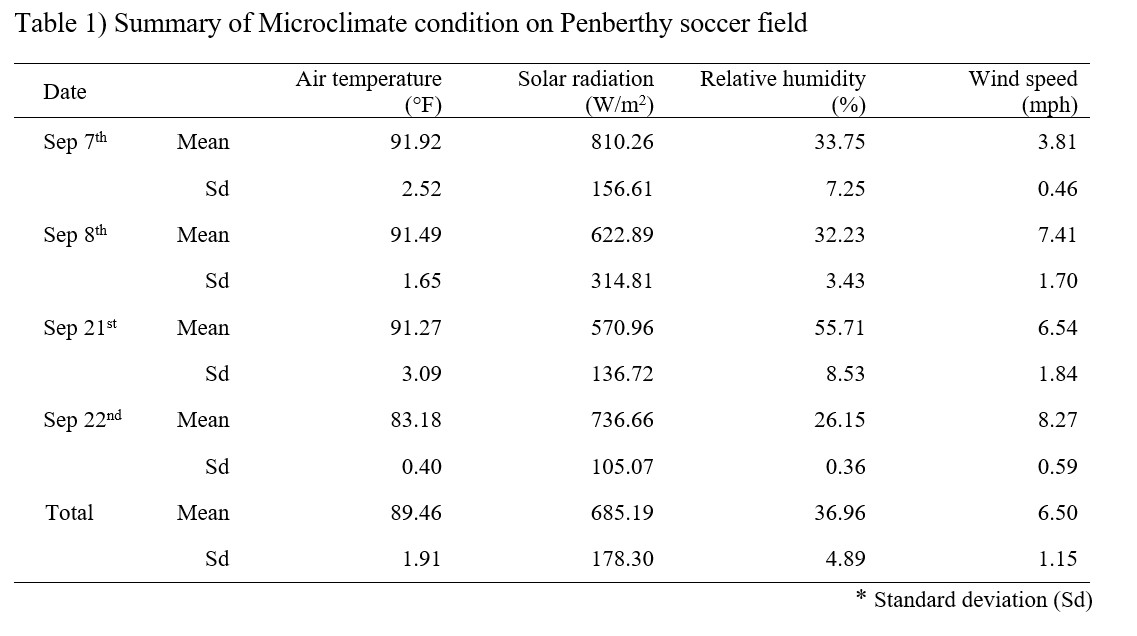
Microclimate conditions of the soccer fields were measured on hot, sunny summer days (Sep 7, 8, 21 and 22 of 2021). Two sets of weather sensors (Maximet 501 and ATOMS 41) were installed at the center of each natural turfgrass and artificial turf field. The microclimate – air temperature (°F), relative humidity (%), wind speed (mph), wind direction, and solar radiation (W/m2) – was collected from 11 a.m. to 6 p.m. CST with a 1-minute recording interval. In addition, the surface temperature was measured every 15 minutes on both filed types by two trained surveyors using a thermal infrared camera (FLIR IR E5). The measurement height of those sensors was five feet above the ground to represent the thermal conditions at an athlete’s chest level. The summary of measured microclimate over four days is presented in Table 1. Although the same weather sensors were not used for data collection, they were thoroughly calibrated prior by multiple field tests.
Questionnaire survey
An on-site questionnaire survey was adopted to measure the perceived thermal stress that the soccer players felt during matches. Over the four days of data collection, six soccer matches (6v6) were played with TAMU men’s club soccer players who volunteered as study participants. Two matches were held approximately 11 a.m. to 1 p.m. CST, and the other four matches approximately 2 to 4 p.m. CST to have a wide range of daytime field thermal conditions. Matches consisted of four quarters, where each quarter of a match lasted 22.5 minutes with a 10-minute break in between. At each break, three out of 12 players were randomly asked to respond to eight questions about how thermally comfortable they were during the matches with a 10-point rating scale, where 0 represented “much too cold” and 10 represented “much too hot.” These questions can be grouped in three parts: 1) perceived exertion (i.e., a laborious or perceptible effort), 2) perceived surface heat conditions, 3) perceived thermal stress. The response rate was 87.5%, meaning 63 out of 72 participants responded to the survey without missing values.
Estimation of objective thermal stress
To evaluate the athlete’s physiological thermal stress, the COMFA energy budget model was employed. It is an outdoor thermal comfort index that estimates the objective thermal comfort of a person based on energy budget equation. In other words, it calculates the physiological thermal load that the human body receives to maintain thermal balance with the surrounding outdoor environment. The energy budget is described as follows:
∆S=M+R-C-K- E (Eq1)
where ∆S is the change in heat storage (W/m2). When the change in heat storage is near 0, the inputs and outputs of energy would nearly balance, and a person would be thermally comfortable. A large positive value would suggest that a person is receiving much more heat than they are giving off, and they would feel too hot. A large negative value would have the opposite effect. The major energy streams are convective heat loss (C), evaporative heat loss (E), conductive heat loss (K), radiative exchange (R), and metabolic heat production (M) (Kenny et al, 2009). The estimated physiological thermal stress, also called energy budget value, can be measured as watt per square meter of a person’s surface area (W/m2), a unit of energy density. The measured microclimate and the athlete’s surveyed exertion level were the main inputs to the COMFA model estimation. The metabolic rate of a running person ranged between 300 – 650 W/m2 depending on exertion level, and the summer uniform was selected to determine the clothing insulation level.
RESULTS
Microclimate condition
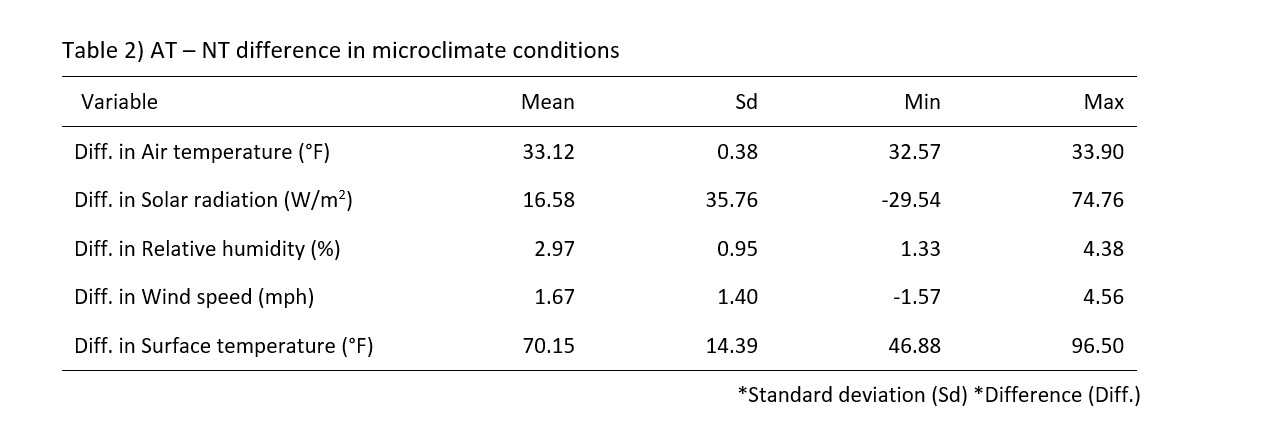
Surface temperature showed a significant difference between NT and AT. The differences in microclimate between the two field types are summarized in Table 2. Regarding the overall pattern, all the measurement values of AT’s microclimate (e.g., air temperature, solar radiation, relative humidity, and wind speed) were slightly higher than NT. However, except for surface temperature, the degree of their difference is not significant considering their error ranges of measurement. In contrast, the surface temperature presented a large deviation between AT and NT, whose average difference was over 70.0 °F.
The daytime pattern of AT and NT surface temperature was further explored to identify the difference in variation over the day (Figure 2). AT’s surface temperature showed considerable fluctuation over time compared to NT’s. Over the four days of measurements, the surface temperature ranged between 104.6°F and 161.6°F for AT and between 86.8° F and 102.6° F for NT. It seems that their daytime mean surface temperature was primarily affected by cloud cover. Overall, the surface temperatures peaked on September 7 when the cloud cover was at the lowest at 10%. Meanwhile, surface temperatures were lowest on September 22 when the cloud cover was relatively higher at 40%, with a somewhat cooler ambient temperature.
The AT – NT difference in surface temperature showed similar daytime patterns with the mean surface temperature. Their difference reached a peak of 96.5°F at 2:30 p.m. CST, September 7 and lowest at 46.8°F at 3:30 p.m. CST, September 22. The degree of temperature gap was likely due to increase from morning to high solar noontime at around 1 p.m. CST and after then declining toward evening at 4 p.m. CST. As surface temperature was the microclimate component primarily determined by field characteristics, we expected it to be a crucial driver causing differences in players’ thermal stress.

Perceived thermal stress (survey response)
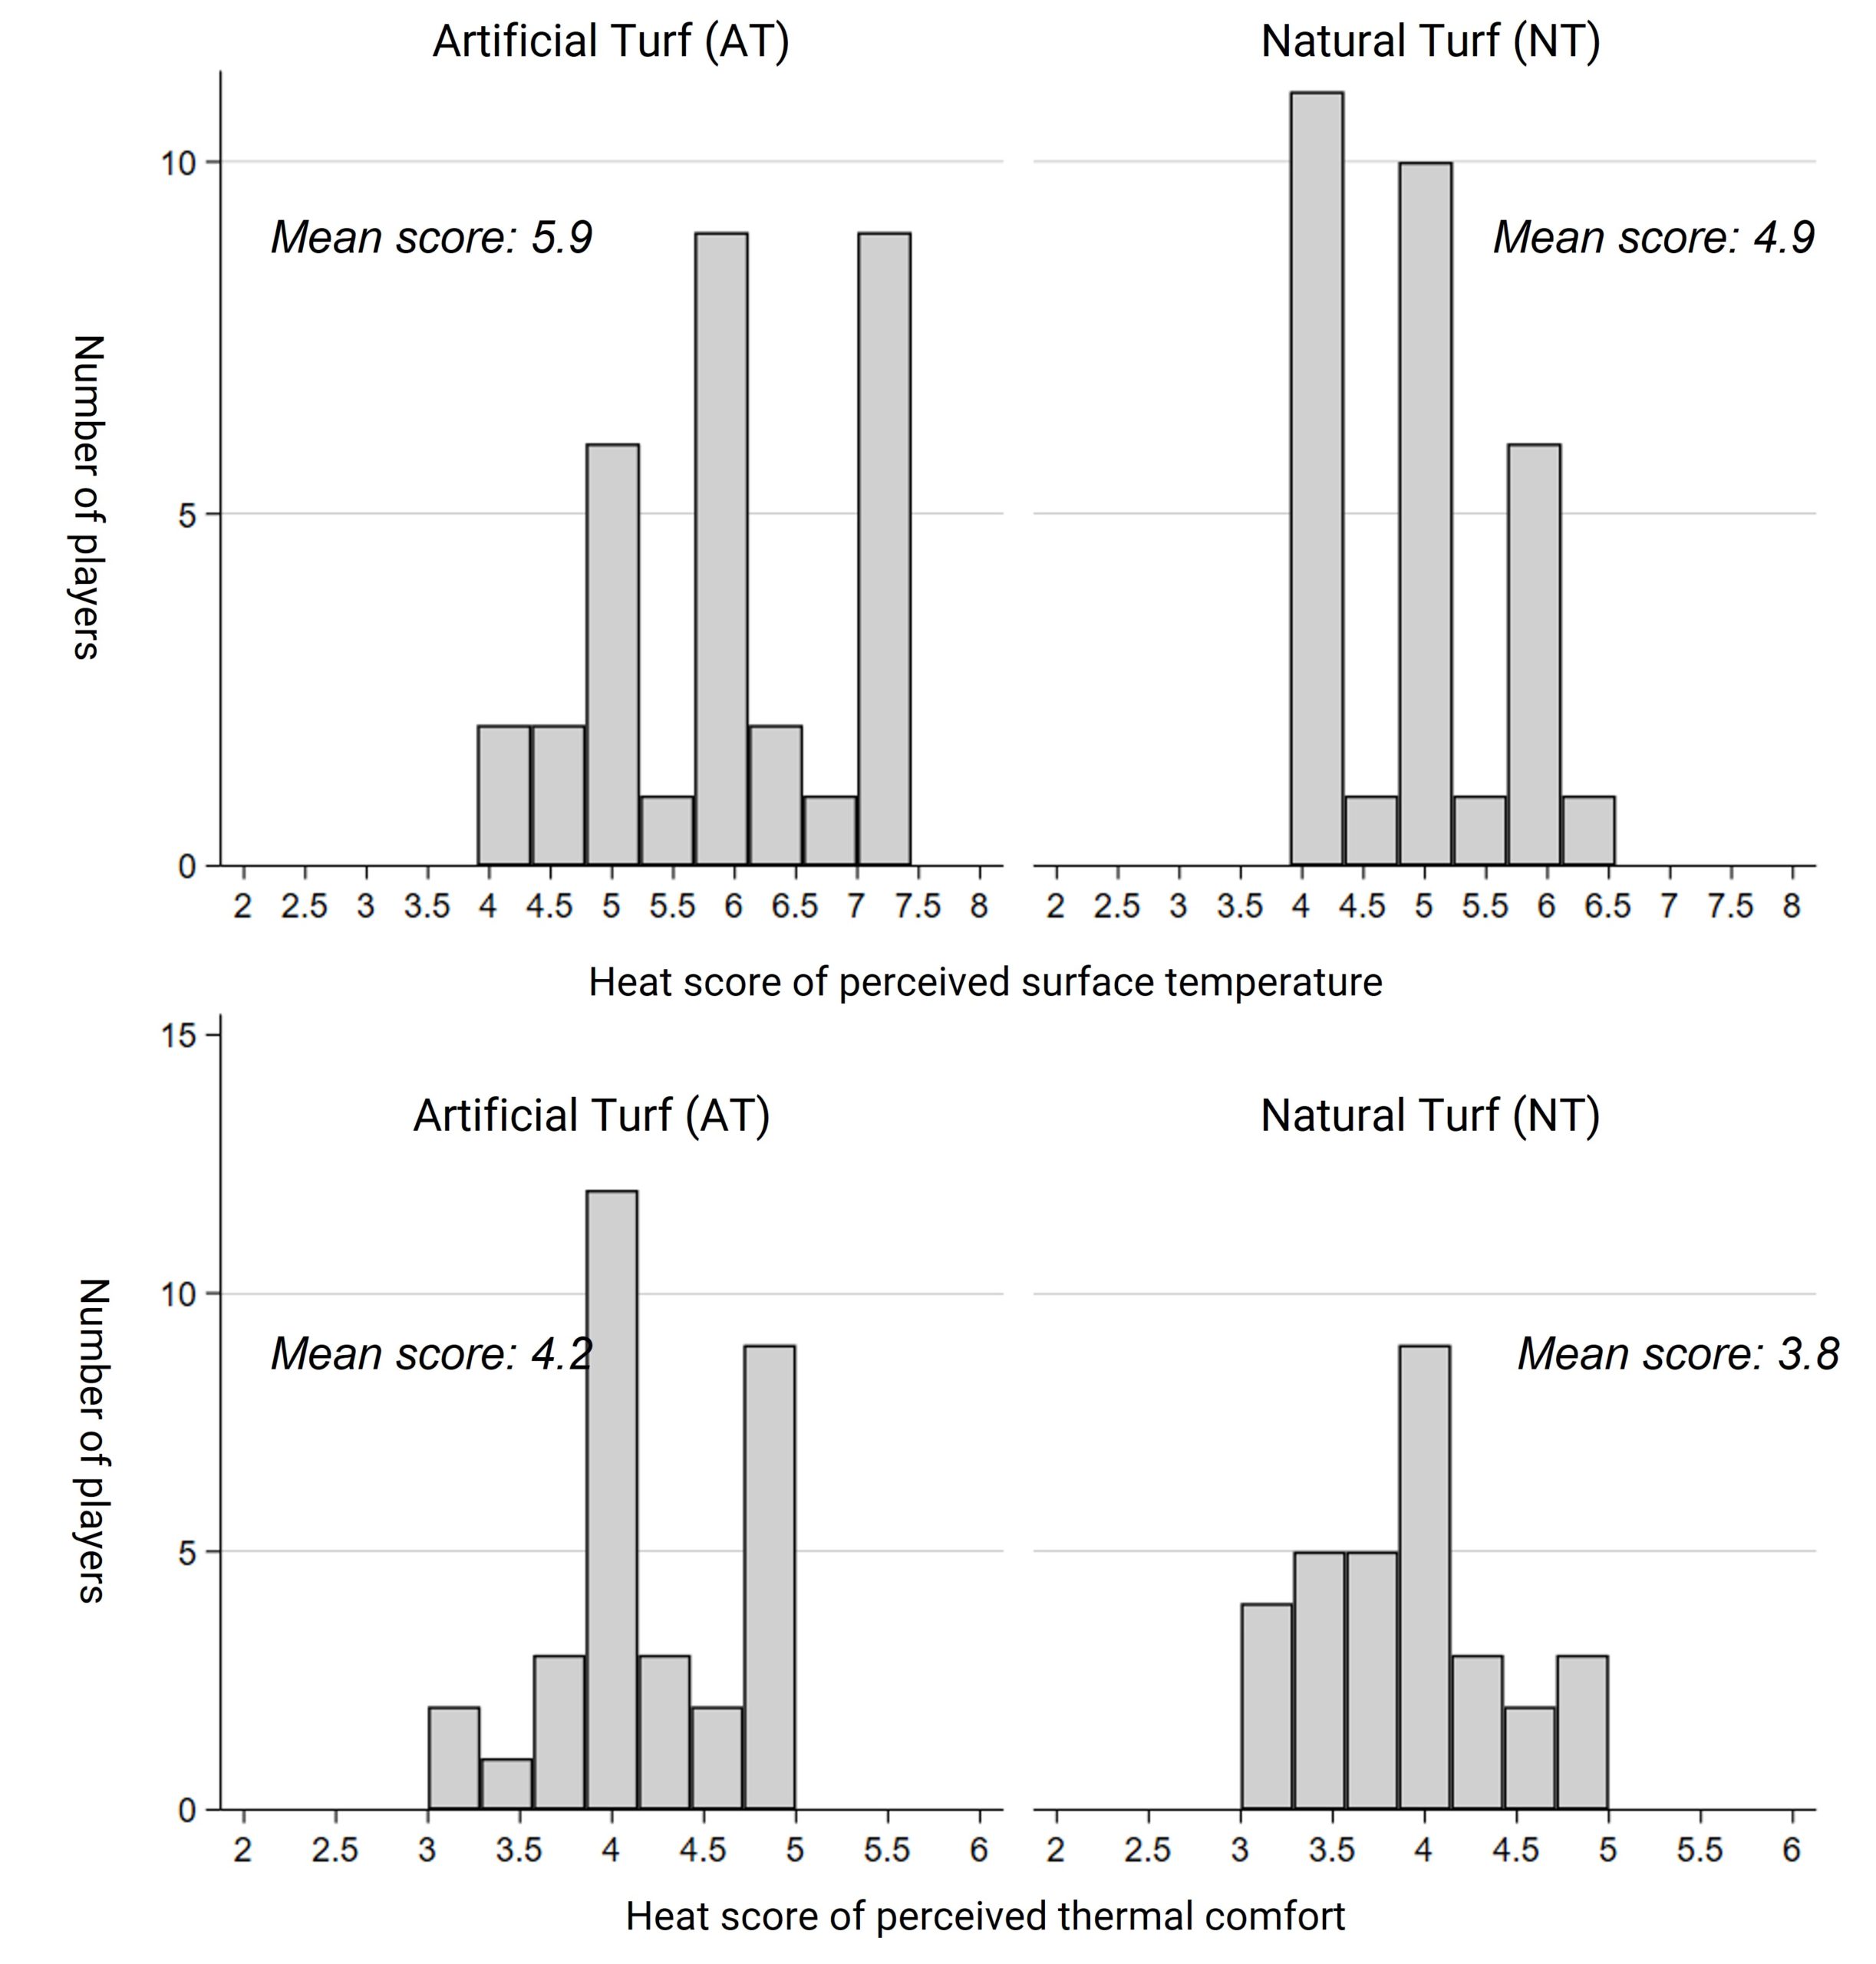
Soccer players felt higher thermal stress when playing on artificial turf (AT) than natural turf (NT). Figure 3 presents the frequency distributions of players’ perceived level of surface temperature and thermal stress for AT and NT. The X axis is the heat scores of perceived surface temperature (upper figure) and perceived thermal comfort (bottom figure), respectively. These values reflect how thermally comfortable they were on each field type during match. The Y axis is the number of players choosing each score. The upper histogram shows that AT has a relatively higher perceived surface temperature score with a broader range than NT. The frequency distribution curve also indicates that the mean AT’s heat score is 6 points, which is one point higher than the mean NT’s. Moreover, the heat score of the AT ranges between 4 and 7.5, which is slightly broader than that of the NT. Regarding the perceived thermal comfort, although the range of heat score range is identical as it ranges between 3 to 5, the mean AT score is at 4.3 points, which is higher than the mean NT score of 3.8.
Objective thermal stress (Energy budget model)
Evaluation of thermal stress on natural and artificial turf
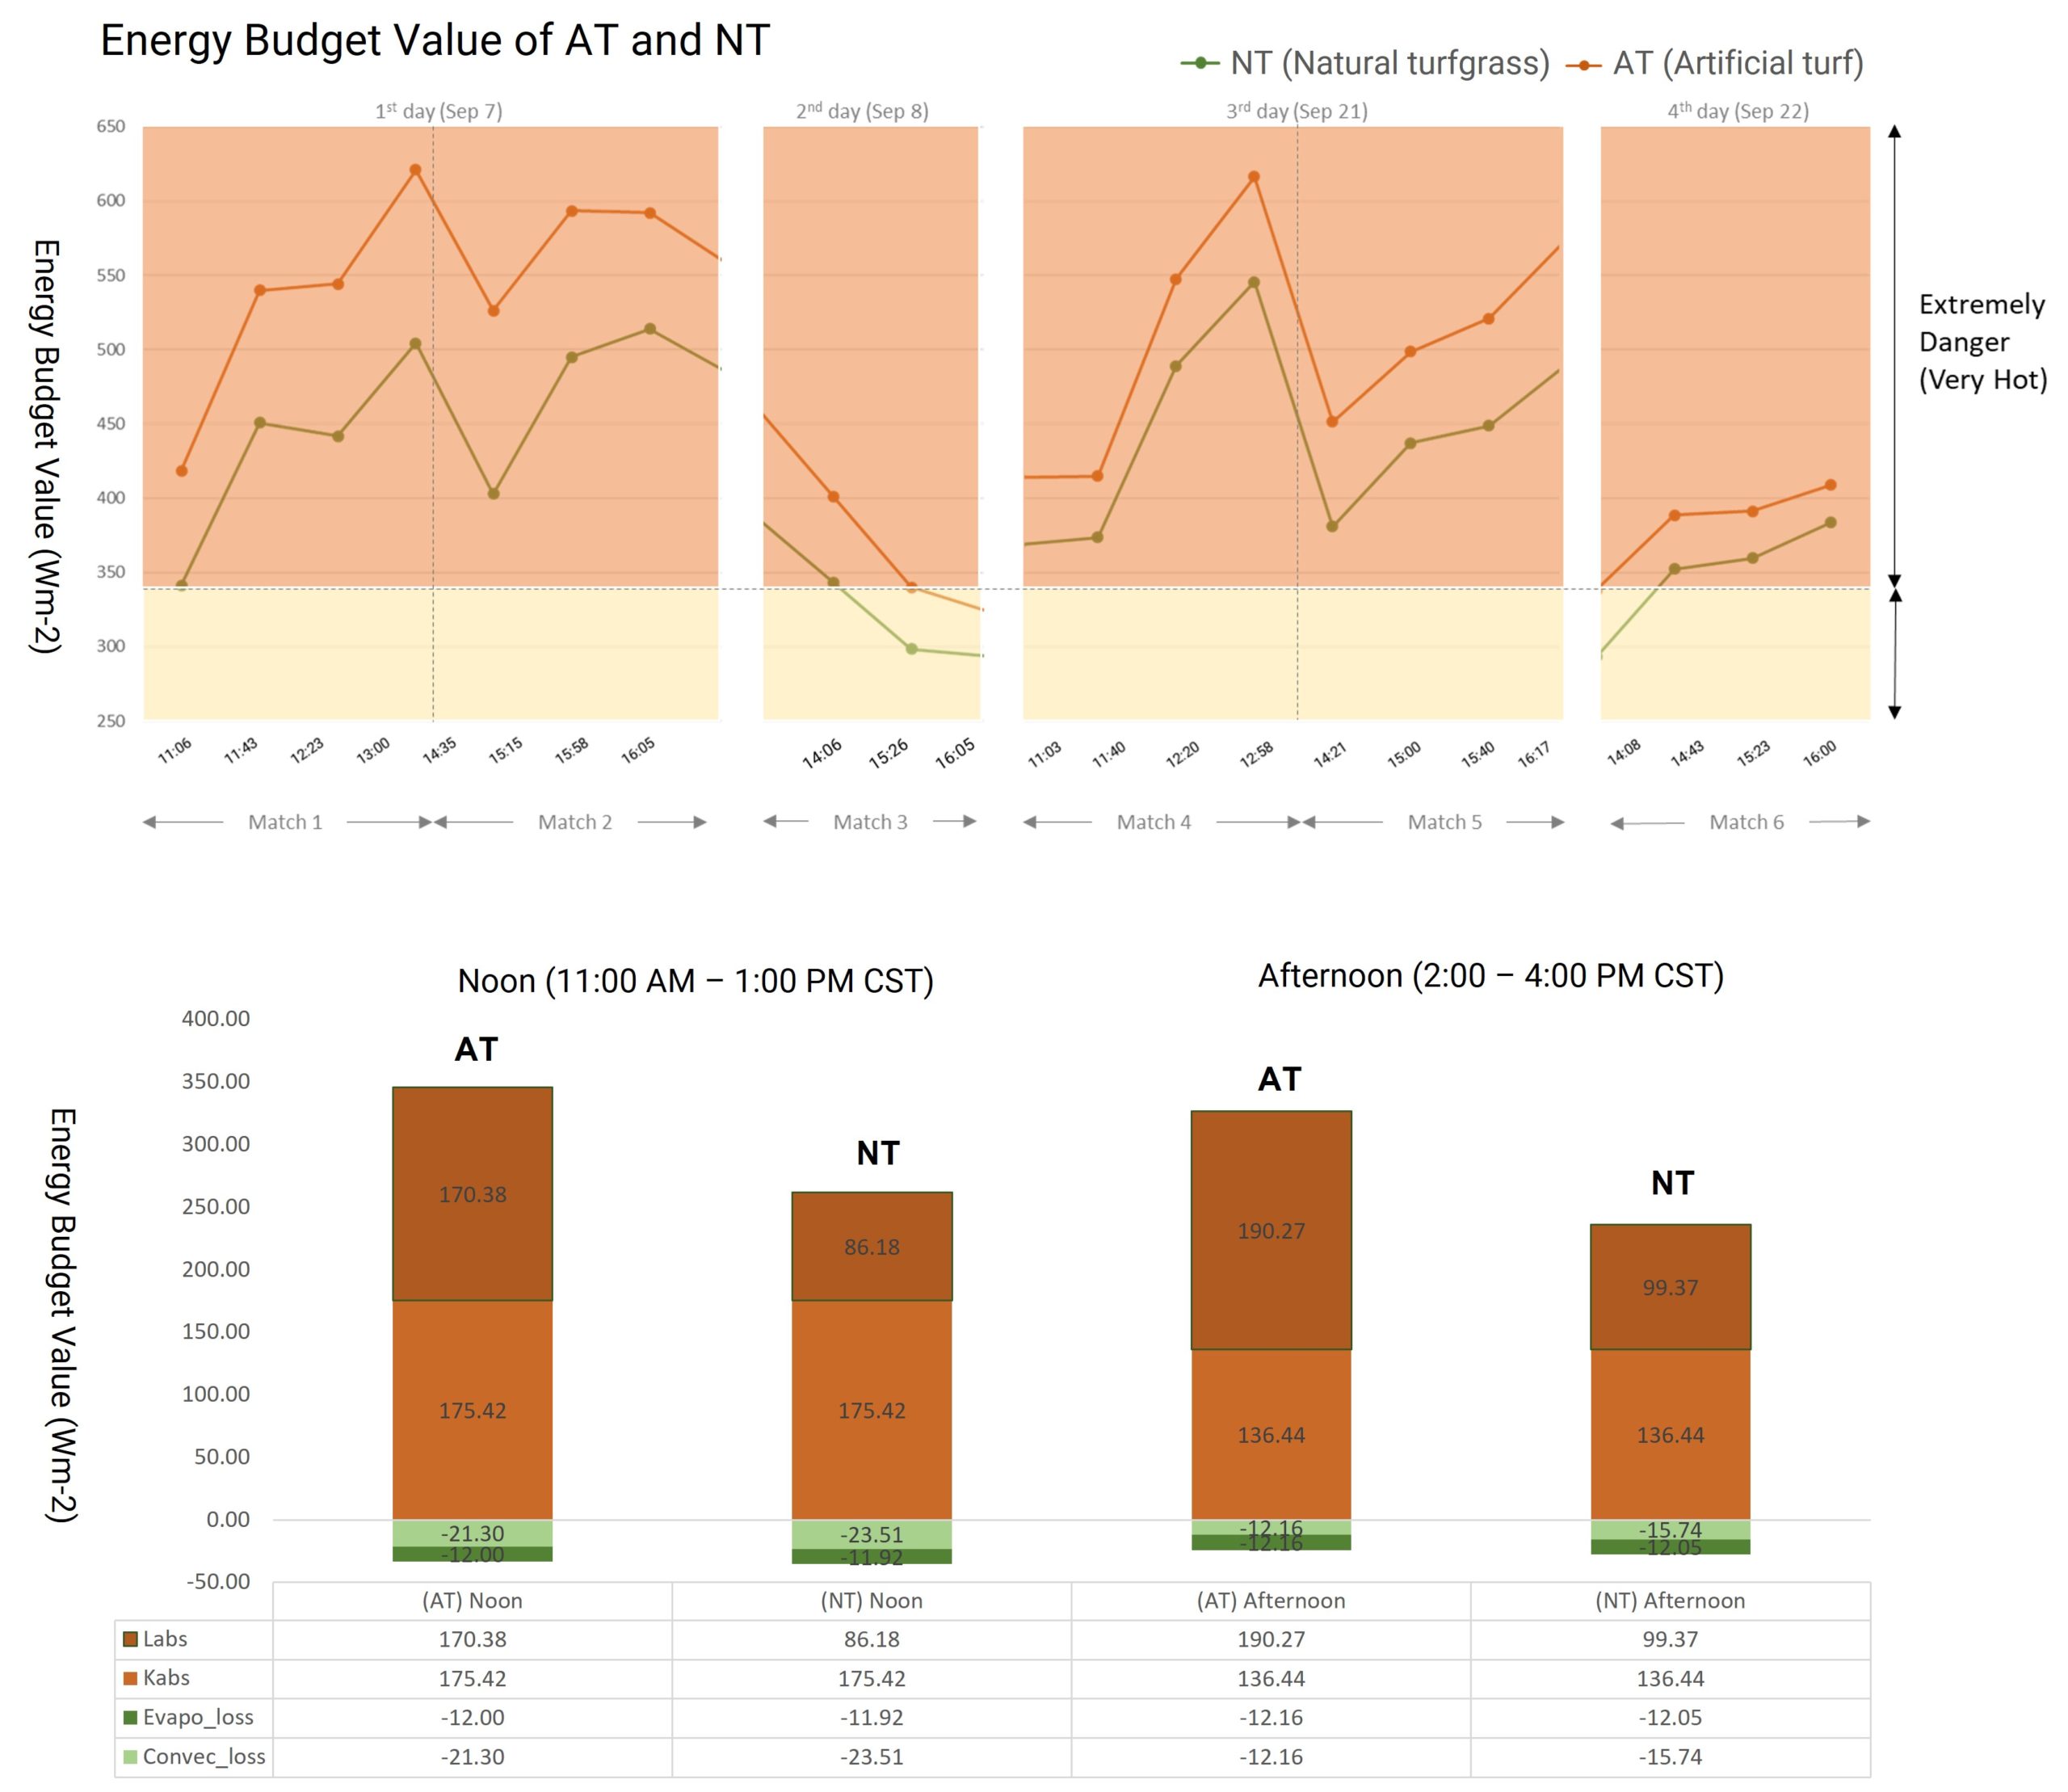
Physiological thermal stress of soccer players on the two field types were evaluated using the COMFA model. The estimated COMFA output was described as energy budget values that can be categorized into four classified thresholds of heat stress values (Harlan et al., 2006): Caution (65–120 W/m2), Extreme caution (121–200 W/m2), Danger (201–339 W/m2), and Extreme Danger (340 or higher W/m2). According to the classification, Figure 4 showed that, for the majority of the match, the players felt very hot and had Extreme Danger levels of thermal stress. Energy budget values reached the peak of 620 W/m2 at 2 p.m. CST on September 7, and arrived at the low of 300 W/m2 at 4 p.m. CST on September 8, and 2 p.m. CST on September 22. Only limited periods, from 2 to 4 p.m. CST on Sep 8 and from 2 to 2:30 p.m. CST on September 22, fell into Danger level of thermal. Their daytime patterns with peak and bottom hours were highly coupled with surface temperature.
When it comes to the AT-NT difference in physiological thermal stress, it was found that NT can reduce the thermal stress of soccer players by up to 20% compared to AT. Overall daytime patterns of thermal stress demonstrated that the difference in energy budget values between AT and NT was 10.6 % higher in the afternoon than the noon during clear sunny days. Their highest difference was on September 7 around 3 p.m. CST at 124 W/m2, while their lowest difference was on September 22 around 4 p.m. CST at 25 W/m2. It seemed that the magnitude of disparities in thermal stress was likely to increase when the shortwave solar radiation (or direct solar beam) coming from the sky was strong. Meanwhile, their disparities tended to decline when the cloud cover was relatively larger with high wind speed.
The most significant components of thermal loading to which players are exposed are Kabs for NT and Labs for AT. Figure 4 indicates individual contribution of four energy components [absorbed solar radiation (Kabs), absorbed terrestrial radiation (Labs), convective heat loss (C), and evaporative heat loss (E)] to thermal loadings that athletes received during daytime hours. The Kabs are the amount of incoming shortwave solar radiation that a player absorbs, and the Labs are the amount of absorbed longwave ground radiation emitted from field. Evaporative heat loss is the loss of body heat that occurs through respiration and perspiration, whereas convective heat loss is the transfer of heat from the body due to the wind. Kabs and Labs comprise the largest proportion of the net energy budget, leading to the overall increase in thermal stress of players. As the Kabs was determined by exposure level to direct solar radiation, no difference was observed between the field types. Meanwhile, the Labs of AT was 97.7% and 91.5% higher at the noon and the afternoon, respectively, compared to NT.
Effects of AT and NT surface temperature on player’s thermal stress
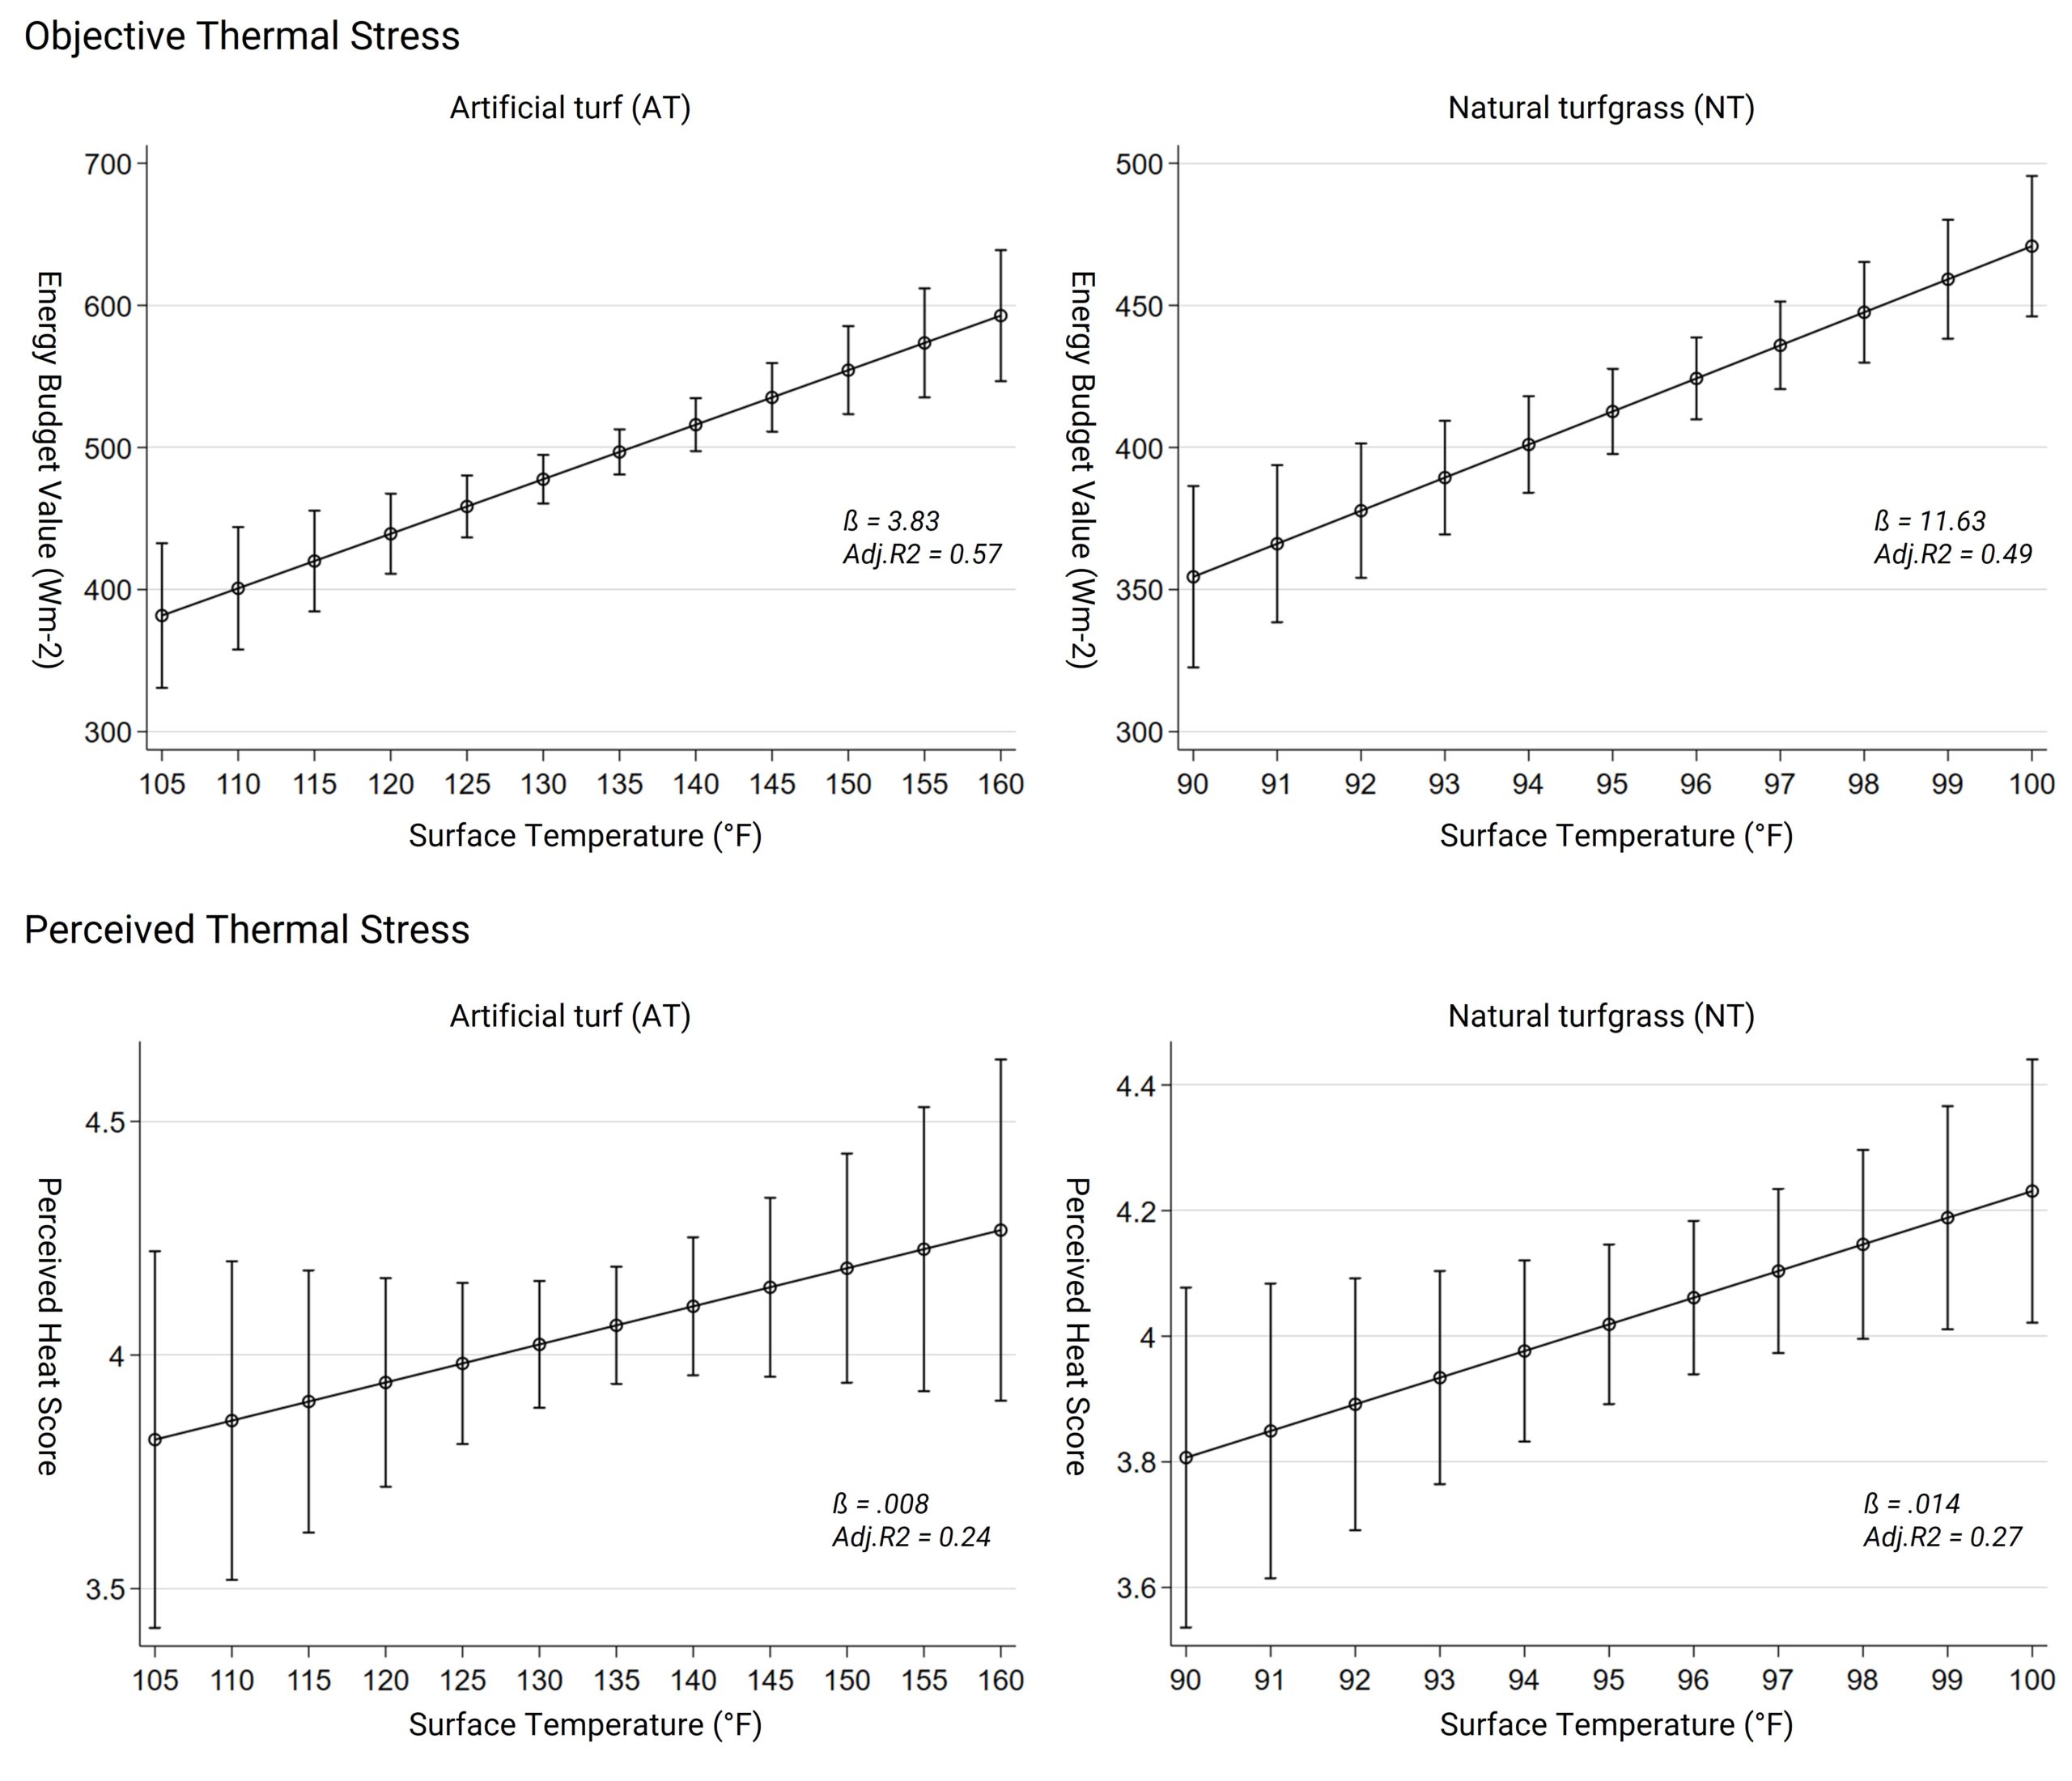
The impact of AT and NT surface temperature on players’ thermal stress was estimated using a statistical modeling procedure called multiple linear regression, where time of day and day of week were considered. Two sets of models were developed for players on each field type – physiological thermal stress and perceived thermal stress. Particular attention was given to (1) the comparison of the impact of turf surface temperature on different types of thermal stress, as well as to (2) investigate the explanatory capacity of turf surface temperature as a proxy of thermal stress. Upper plots showed the predicted changes in physiological thermal stress (W/m2) by an increase in one Fahrenheit degree of AT and NT surface temperature, whereas the bottom plot indicated the predicted shifts in perceived thermal stress. All models were statistically significant, indicating that both filed types affect physiological and perceived thermal stress significantly.
The impact of surface temperature on athletes’ thermal stress is higher on NT than AT. The coefficient slope of NT is 11.6 for physiological thermal stress, meaning that the 1°F increase in surface temperature led to 11.6 growth in energy budget values (W/m2). The coefficient slope of AT was 6.9m, which was three times less than NT. Interestingly, a similar outcome was found in perceived thermal stress, where NT’s coefficient slope (0.014) was higher than AT’s (0.008). These findings indicate that both the perceived and physiological thermal stress of the players are more sensitive when they are performing on NT. We assume that this is mainly due to the higher thermal stress level on AT that may result in the reduced performance (or amount of activity) and lower metabolic rates leading to decreases in thermal stress of players compared to NT.
Explanatory power of surface temperature for thermal stress varies on the types of thermal stress. In this study, explanatory power indicates the ability on how much variations in players’ thermal stress can be explained by the surface temperature. Overall, the surface temperatures showed better performance in explaining athletes’ physiological thermal stress than the perceived thermal stress model. In the physiological thermal stress model, the explanatory power (or adjusted r-squared) values are 57% and 49% for AT and NT, respectively, which are around 30% higher than the perceived thermal stress model. This implies that, considering their high explanatory power of around 50%, surface temperature can be considered a superior proxy when it is used for measuring the physiological thermal stress of soccer players.
CONCLUSION
Our findings confirmed that surface temperature is the main driving factor that leads to an increase in both perceived and physiological thermal stress of the soccer players in summer daytime. The highlights of the key findings are as follows:
- Mean AT-NT difference in surface temperature was over 68.0°F, which tends to be more pronounced when the direct solar beam is stronger, and the time reaches solar noon at around 1 p.m. CST
- Athletes performing on AT had higher perceived and physiological thermal stress than those on NT. Compared to AT, NT can reduce the physiological thermal stress by up to 20% in a setting of a clear, hot and sunny day.
- The impact of NT surface temperature on player’s perceived and physiological thermal stress is higher than that of AT. This implies that athletes are likely to be more sensitive to field heat conditions when performing on NT.
The findings of this study are useful for biometeorology and sports field management to enhance the athletes’ safety from heat stress and increase their match performance. Future studies need to address how the difference in thermal stress induced by AT and NT affects the athlete’s physical performance and physiological body changes, such as hydration.
YouJoung Kim, Ph.D., Department of Landscape Architecture and Urban Planning; Chase Straw, Ph.D. Department of Soil and Crop Sciences; Steven E. Riechman, Ph.D. Department of Health and Kinesiology; Brown D. Robert, Ph.D. Department of Landscape Architecture and Urban Planning, Texas A&M University, College Station, Texas.
Research reported in this publication was financially supported by The Lawn Institute.
REFERENCES
Francis, R. A. (2018). Artificial lawns: Environmental and societal considerations of an ecological simulacrum. Urban Forestry & Urban Greening, 30, 152-156.
Guyer, H. (2020). Athletic Surfaces‘ Influence on the Thermal Environment: An Evaluation of Wet Bulb Globe Temperature in the Phoenix Metropolitan Area. Arizona State University, Temple, AZ
Harlan, S. L., Brazel, A. J., Prashad, L., Stefanov, W. L., & Larsen, L. (2006). Neighborhood microclimates and vulnerability to heat stress. Social science & medicine, 63(11), 2847-2863.
Jim, C. Y. (2017). Intense summer heat fluxes in artificial turf harm people and environment. Landscape and Urban Planning, 157, 561-576.
Kenny, N. A., Warland, J. S., Brown, R. D., & Gillespie, T. G. (2009). Part A: Assessing the performance of the COMFA outdoor thermal comfort model on subjects performing physical activity. International Journal of Biometeorology, 53(5), 415-428.