By Conlan Burbrink, M.S., Weston Floyd, CSFM, Athol Thomson, Ph.D., Steven Riechman, Ph.D., and Chase Straw, Ph.D.
Measuring sports field characteristics (e.g., surface hardness, soil moisture, etc.) can provide valuable information to guide management toward the safest, most consistent and most playable field conditions for athletes. Studies comparing playing field characteristics and athletes’ movements or biomechanics have been limited to laboratory studies due to the need for embedded force plates or motion capture systems. However, mimicking real-world, game-relevant athlete movements is an issue. Therefore, there is a need to compare field characteristics and athlete biomechanics on actual sports fields to better understand what the values mean in relation to athlete-surface interactions in real-world scenarios.
With recent advancements in wearable technology, athlete-surface interactions can be explored in the field. These wearables can quantify how quickly athletes accelerate or decelerate, how far they run, or even forces felt at their lower extremities. The latter could be used as a precursor to indicate increased likelihood of overuse injuries (cramps, lower leg pain, etc.) on fields with certain surface characteristics such as fields that are too soft or too hard1. The purpose of this study was to utilize ankle-worn wearable technology to evaluate athletes’ peak tibial accelerations (i.e., the maximal force felt at the tibia while performing athletic maneuvers) on natural turfgrass and synthetic turf fields when performing drop landing, drop jump, and acceleration/deceleration activities. The intention of this study was not to compare natural turfgrass and synthetic turf, but rather to evaluate peak tibial accelerations with wearable technology under contrasting sport field characteristic values.
Methods
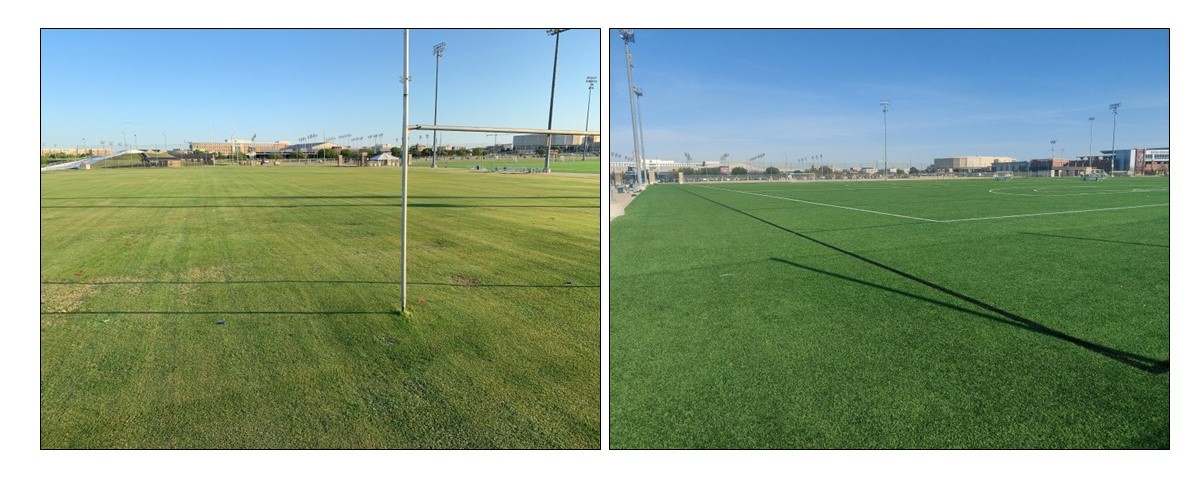
The study was approved by the Texas A&M University (TAMU) Institutional Review Board, and conducted in coordination with the TAMU Men’s Club Rugby team during the 2021 spring semester. On two separate days, participants were asked to perform athletic activities on natural turfgrass and synthetic turf fields. The natural turfgrass field consisted of ‘Tifway 419’ hybrid bermudagrass [Cynodon dactylon L. Pers. × C. transvaalensis Burtt-Davy] overseeded with perennial ryegrass (Lolium perenne L.) and constructed on a sand-based rootzone maintained at 19 mm (0.75 in.; Figure 1). The synthetic turf field (AstroTurf RootZone 3D3 Blend 52; Dalton, Georgia) was a 4-year-old blended monofilament slit film system with a nylon rootzone infilled with crumb rubber (Figure 1). Both fields receive regular usage by various intramural and club sports at the university throughout the year, and are routinely maintained by a Certified Sports Field Manager.
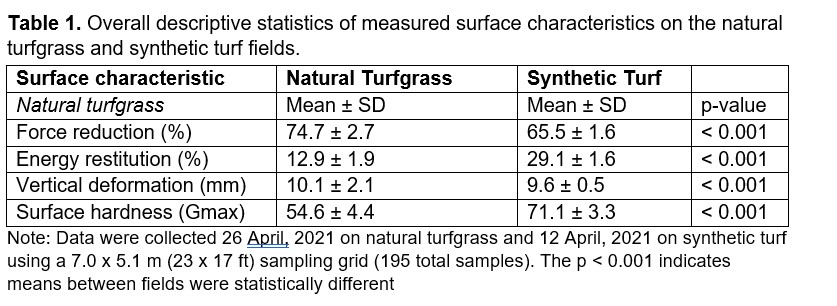
Several field characteristics were quantified the day prior to athlete activities from 195 locations within each field using a 7.0 x 5.1 m (23 x 17 ft.) sampling grid. A Deltec Field Tester (Deltec Equipment; Duiven, Netherlands) was used to measure force reduction (i.e., the amount of force a surface reduces once force is applied to it with the testing device), energy restitution (i.e., the amount of energy returned to the testing device once force is applied to it with the testing device), vertical deformation (i.e., the depth the surface deforms to once force is applied to it with the testing device), and surface hardness (i.e., the maximal deceleration once force is applied to it with the testing device). Soil moisture was measured on the natural turfgrass field using a TDR 350 Soil Moisture Meter (Spectrum Technologies, Inc., Plainfield, Ill.) and infill depth was measured on the synthetic turf field using a Turf-Tec Professional Model Infill Depth Gauge (Turf-Tec International, Tallahassee, Fla.). Sports field characteristics were compared using a t-test (α = 0.05).
Nineteen healthy male TAMU Club Rugby athletes were recruited to participate in the study. The participants performed their 15-minute team warmup and then three athletic activities:
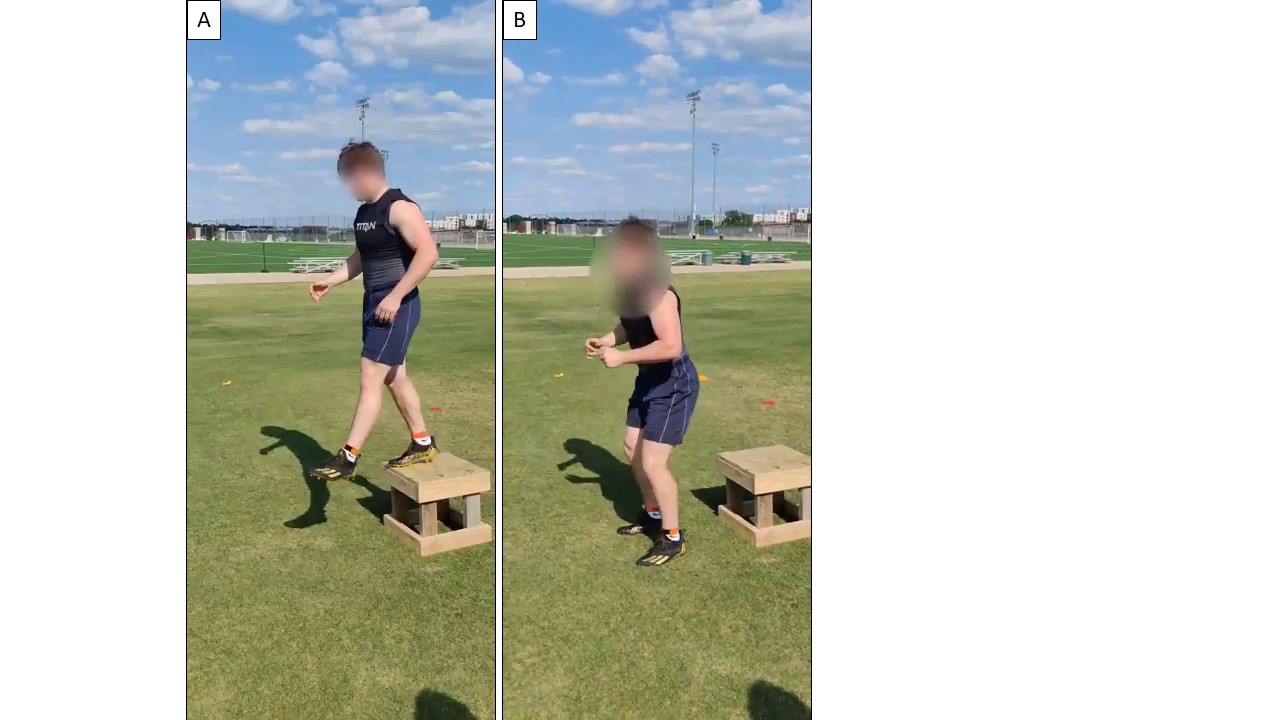
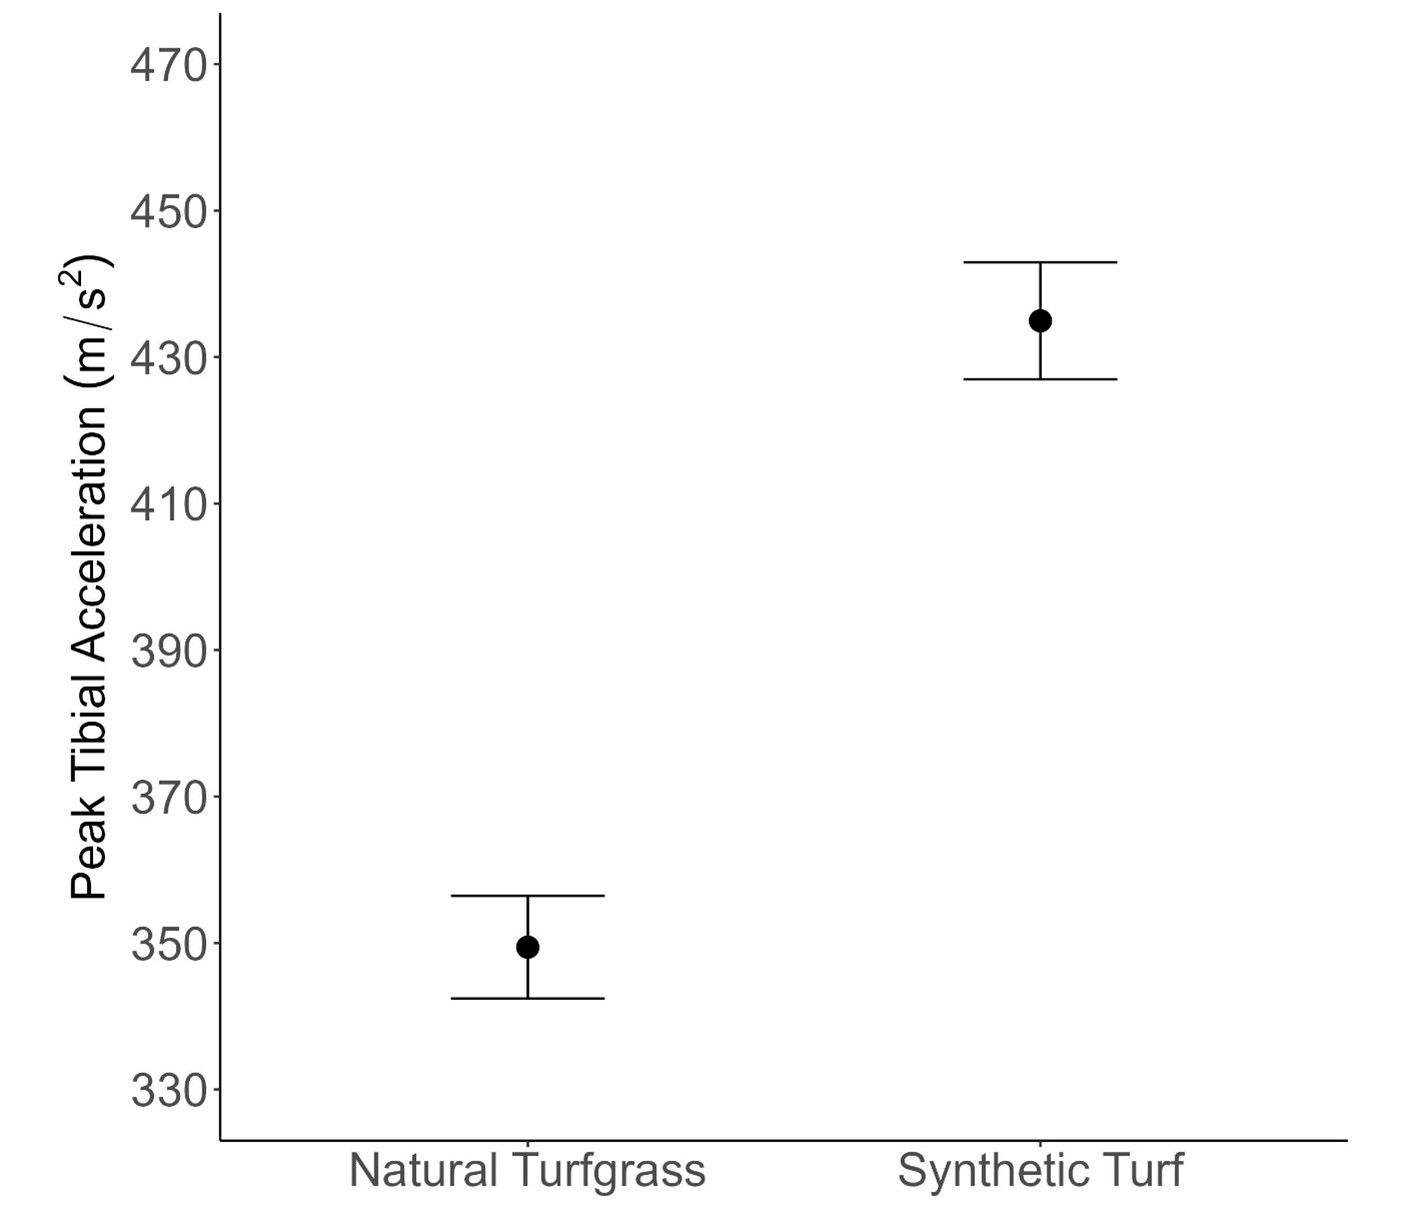
1. A drop landing activity where athletes stepped off a 40 cm (15.75 in.) platform and landed evenly on both feet (Figure 2).
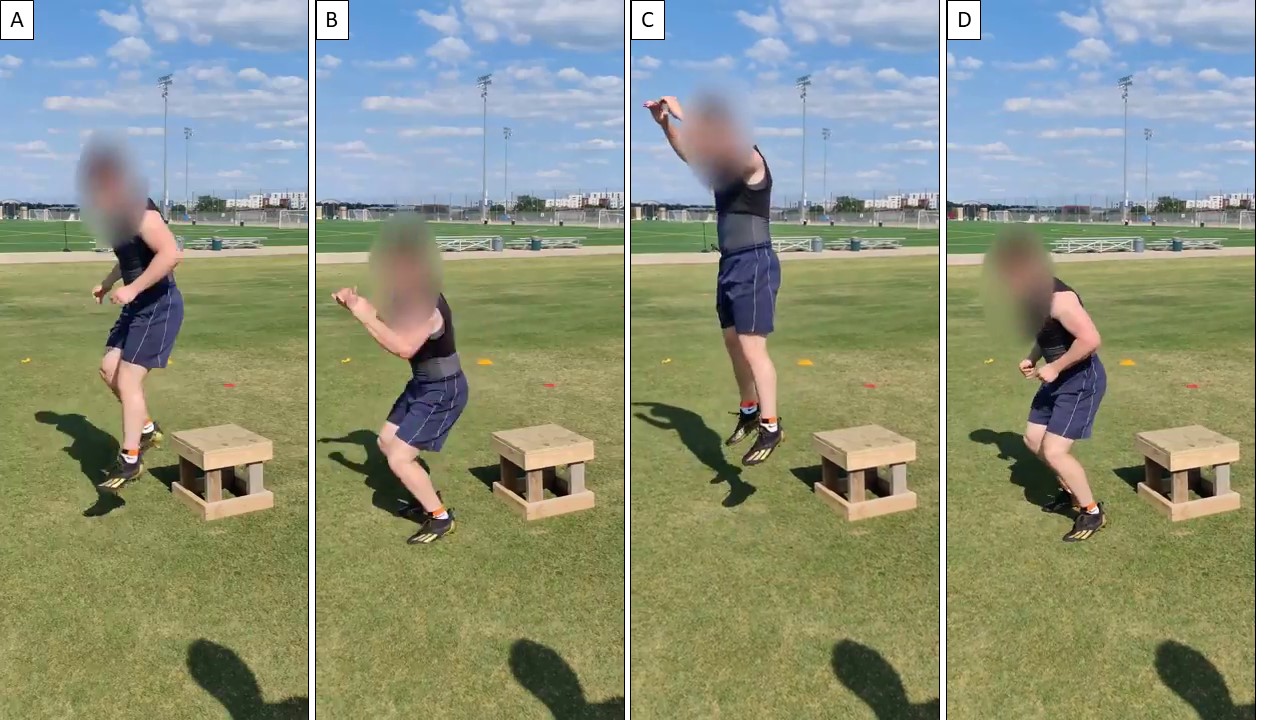
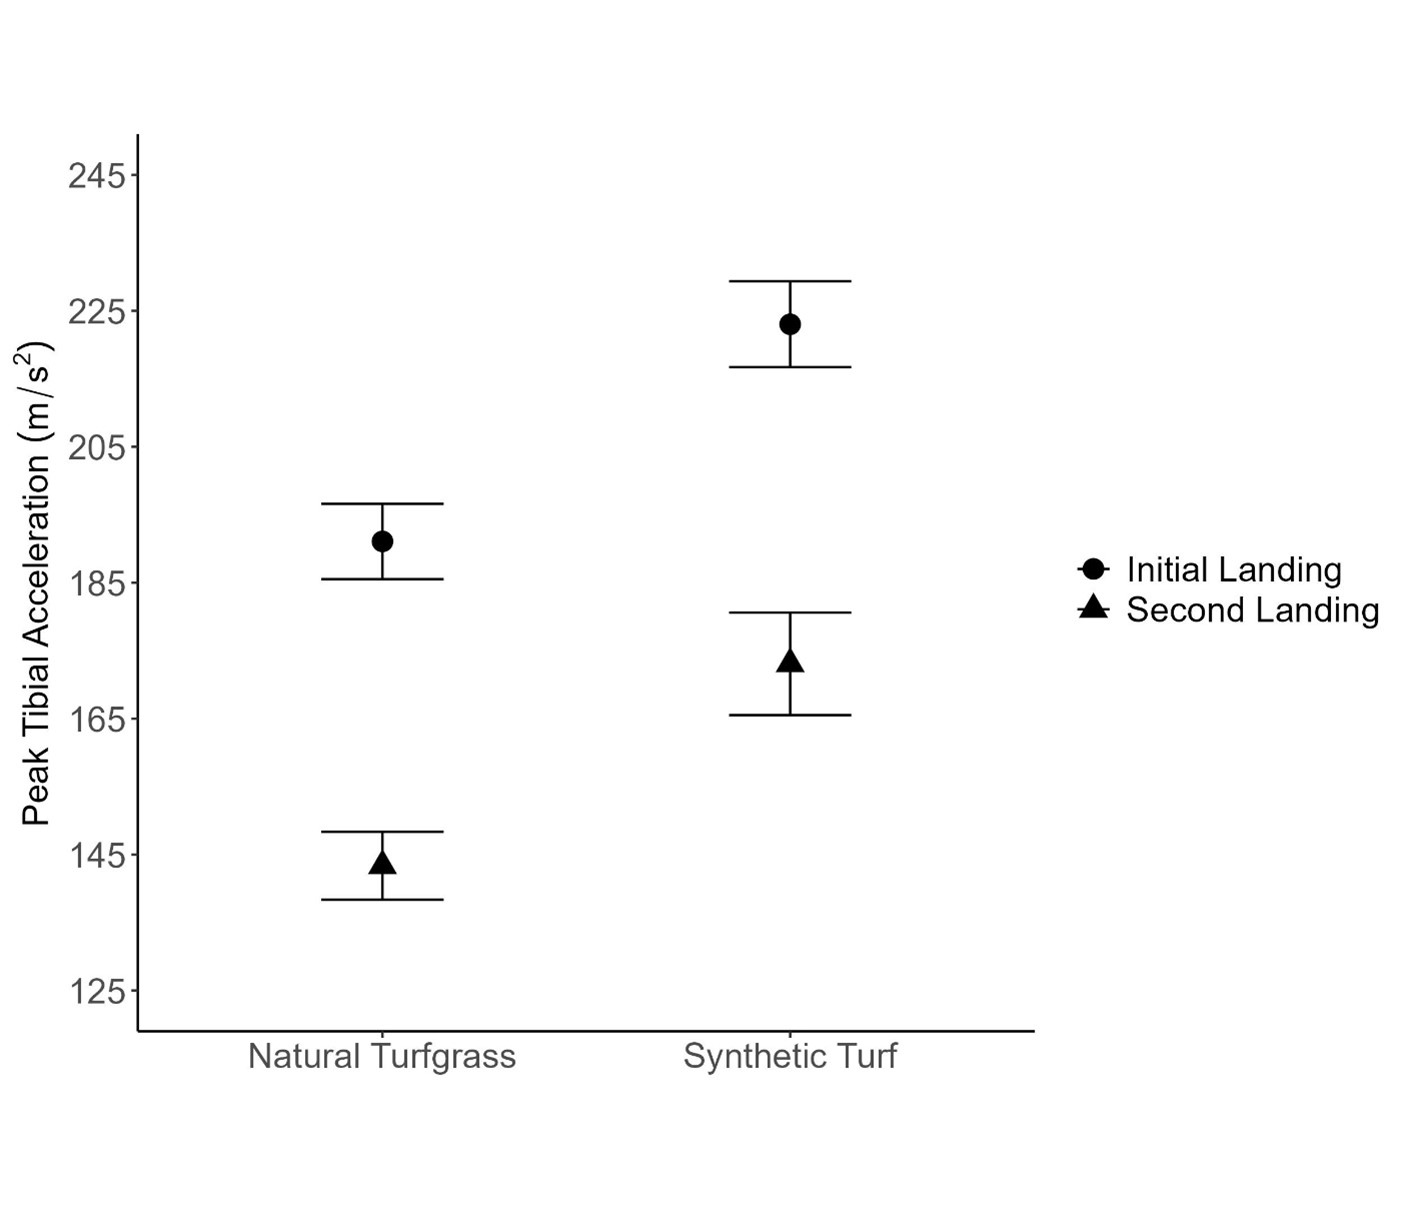
2. A drop jump activity where athletes stepped off the 40 cm (15.75 in.) platform, landed evenly on both feet, jumped vertically as quickly as possible, and landed back on both feet (Figure 3).
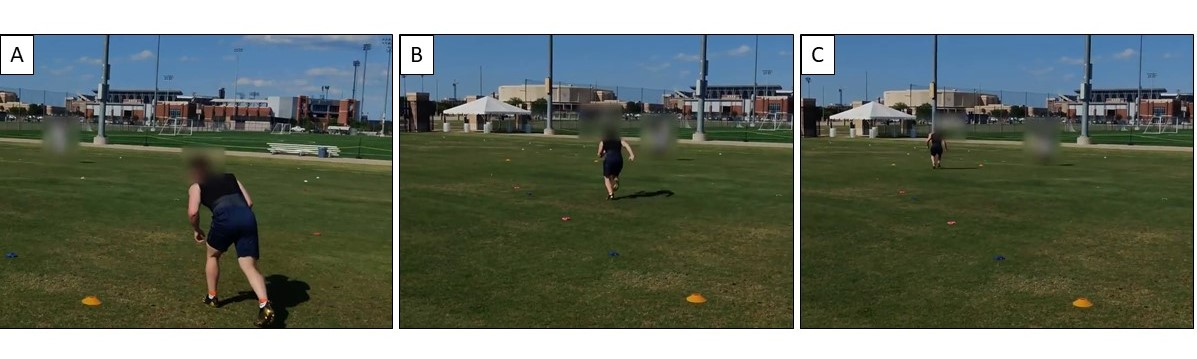
3. An acceleration/deceleration ability activity where athletes accelerated as quickly as possible for 20 m (65.5 ft.), then decelerated as quickly as possible into a backpedal (Figure 4).
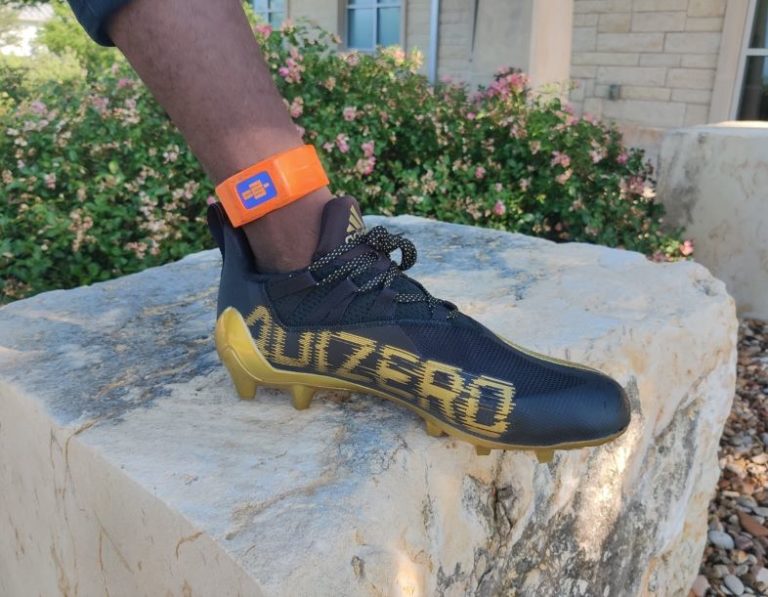
Athletes repeated these activities three times in two locations within each field (six total replications). They were given adequate resting time between each replication and activity. Athletes were fitted with the same model cleat (Adizero 11.0; Adidas, Herzogenaurach, Germany) to control for shoe-induced variability. Furthermore, accelerometers (± 200 g at 1,600 Hz; Blue Trident IMU; Vicon Motion System, Denver, Colo.; top photo above) were affixed around the athletes’ ankles to determine the peak tibial accelerations during each activity. Peak tibial accelerations between fields were compared using a t-test (α = 0.05).
Results and conclusions
The natural turfgrass field had a statistically higher mean force reduction value than the synthetic turf field (Table 1), meaning more energy was absorbed by the natural turfgrass surface. Energy restitution was also statistically different between the two fields, where the synthetic turf field would, in theory, return more energy up toward an athlete compared to the natural turfgrass field. Vertical deformation was statistically less on the synthetic turf field compared to the natural turfgrass field, which means the synthetic turf field didn’t deform as much as the natural turfgrass field. Additionally, the natural turfgrass field had a statistically lower mean surface hardness than the synthetic turf field. The synthetic turf field fell within the World Rugby’s standards for force reduction (55 – 70%), energy restitution (20 – 50%), and vertical deformation (5.5 – 11 mm), whereas the natural turfgrass field only met the vertical deformation requirement and fell beneath the threshold for force reduction and energy restitution. No standards currently exist for World Rugby for surface hardness. The mean infill depth for the synthetic turf field was 36.9 mm with a standard deviation of 2.6 mm. The natural turfgrass field had an average volumetric water content of 16.0% and a standard deviation of 7.2% (see Table 1).
Athletes exhibited 19.5% lower peak tibial accelerations during the drop landing activity on the natural turfgrass field versus the synthetic turf field (p>0.001; Figure 5). Athletes’ peak tibial accelerations during the drop jump activity on natural turfgrass were 13.2% lower for the initial landing and 20.0% lower for the second landing compared to the synthetic turf field (p<0.001; Figure 6). Furthermore, athletes performing the acceleration-deceleration activity also exhibited a 20.4% reduction in peak tibial accelerations on the natural turfgrass field relative to the synthetic turf field (p<0.001; Figure 7).

In all three activities, athletes exhibited lower peak tibial accelerations on the natural turfgrass field, which aligns with field testing results because that field absorbed more energy, returned less energy, deformed the most, and was softest. Although the study was small-scale, these results highlight that the techniques used to quantify sports field characteristics aligned with expected results from wearable athlete technology. Additionally, the findings reinforce the usefulness of field testing to guide maintenance decisions that may impact athlete-surface interactions (e.g., aerifying hard fields or rolling soft fields). It is important to note again that the intention of this study was not to compare field types (natural turfgrass and synthetic turf); instead, it was to evaluate peak tibial accelerations using wearable technologies between fields with contrasting sport field characteristic values. Natural turfgrass sports fields can be highly variable over time; so, to make direct comparisons with synthetic turf, further research is necessary under similar sports field characteristic conditions.
Conlan Burbrink, M.S. – Ph.D., is a student of Turfgrass Science and Management at the University of Tennessee; Weston Floyd, CSFM, is research specialist II at Texas A&M University; Athol Thomson, Ph.D., is podiatrist and research scientist at Aspetar Orthopedic and Sports Medicine Hospital; Steven Riechman, Ph.D., is associate professor of Kinesiology at Texas A&M University; and Chase Straw, Ph.D., is assistant professor of Turfgrass Management and Physiology at Texas A&M University.
Reference:
1. Sheerin KR, Reid D, Besier TF (2019) The measurement of tibial acceleration in runners-A review of the factors that can affect tibial acceleration during running and evidence-based guidelines for its use. Gait Posture 67:12–24. https://doi.org/10.1016/j.gaitpost.2018.09.017