By Casey Reynolds, Ph.D.
The college and professional football seasons are winding down, and sports fans can feel the excitement in the air. As always, national championship predictions and other team chatter is in the news, but also making headlines this year are several recent retirements of prominent football players citing, in part, concerns over their long-term safety and health. The safety and health of athletes is and should be a top priority for leagues, coaches, parents and others. However, what other factors are considered when installing new athletic fields? Is it maintenance, costs, environment, or other factors? Is it all of the above, and, if so, which factors play most heavily in these decisions? This was the topic of market research conducted in 2018 in the United States and Canada.
Six companies submitted proposals for this market research and FleishmanHillard, a global PR firm and digital marketing agency based in St. Louis, was selected as the winning proposal. FleishmanHillard has more than 80 offices in 30 countries, and, as such, is able to reach domestic and international audiences.
First, FleishmanHillard analyzed the current state of affairs in print and social media with regard to natural grass and synthetic turf. Natural grass proponents and synthetic turf companies tout many of the same benefits including cost, environmental impact, durability and safety – many of consumers’ major concerns. They also analyzed the share of each group’s voice in digital media, as well as the positive, neutral and negative perceptions by subject for natural grass and artificial turf. One of the key items that jumped out was that it appears natural grass fields are taken for granted. There are fewer arguments for natural grass, rather than against artificial turf, because natural grass is in the default position. Artificial turf often gets more coverage and has non-neutral articles, in part simply because it is new and debated.
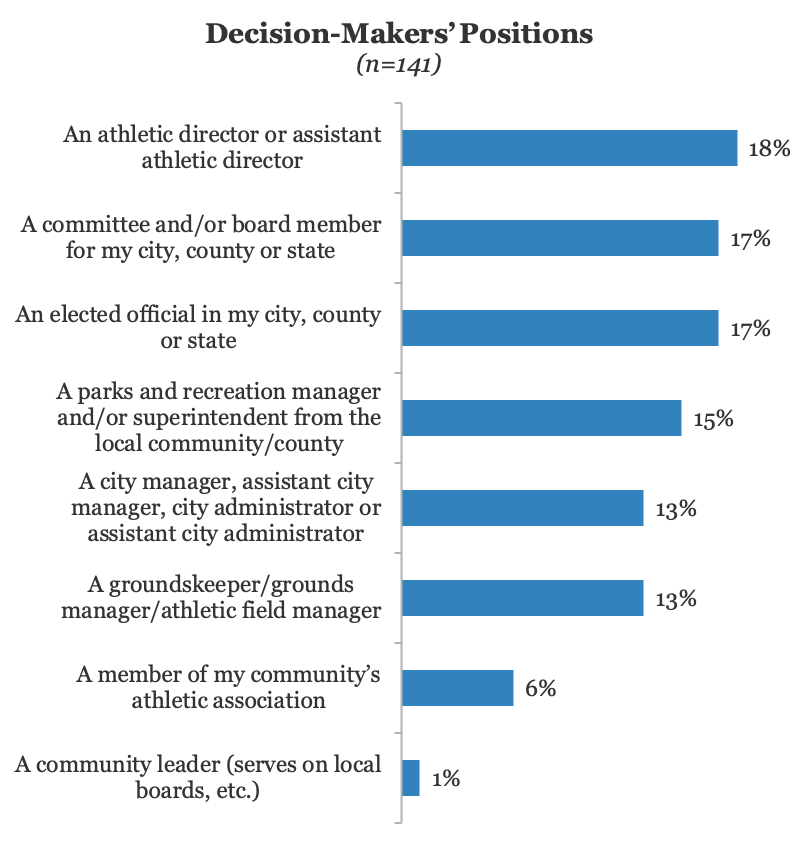
In addition to an analysis of print and digital media, FleishmanHillard surveyed 141 decision-makers (coaches, athletic directors, city employees, etc.) in the United States and Canada (Figure 1) to get an idea of what they determined as motivating factors when selecting new playing surfaces for their communities. These respondents were presented with a series of statements revolving around considerations of various playing surfaces and asked for their feedback. Their knowledge and responses to these statements were then compiled for analysis to determine the many factors that go into deciding between natural grass or synthetic turf athletic fields, mulch or rubber playground surfaces, and more.
As you can imagine, the safety and health of users was a top response. There are many factors that contribute to the safety of various types of playing surfaces, including, but not limited to, construction and management practices, heat, surface hardness, consistency, and even footwear. There are many types of playing surfaces that have a role in communities everywhere. For example, a playground at a child’s daycare center in the southern United States may be more concerned about heat loading than a multi-use event complex in the Pacific Northwest. Inversely, a collegiate or professional soccer or football complex may be more concerned about traction/footing than an outdoor concert venue. As you can imagine, each of these types of venues lend themselves to different playing surfaces and management techniques, but a common theme throughout each of them is user safety.
Field safety has long been a research topic among the scientific and medical professions, and there have been many research papers published in academic journals citing varying differences in surface types. Many of these studies use some type of injury surveillance reporting system to seek out and analyze trends in injuries in different playing surfaces. For example, the National Collegiate Athletic Association (NCAA) has collected injury data through its Injury Surveillance System (ISS) since 1982 (Kerr et al 2014). The National Football league (NFL) has recorded and reported injuries using a similar system since 1980 (Hershman et al 2012). These types of injury-recording systems are capable of capturing data on injury type, weather conditions, playing surface, athlete exposures (AE), and more. These reporting systems allow medical trainers and researchers to access and analyze vast sets of comprehensive data over extended periods of time.
Two papers that have been recently published in the American Journal of Sports Medicine focus on injury data analysis from the NFL and the NCAA. Previous research has revealed that football cleats interact differently on synthetic and natural turf, which may lead to a different risk of injury. Divots – when a cleat creates a hole in the field – signal that the grass has absorbed force from the cleat and released the cleat back again, rather than capturing the cleat and releasing the force through a players’ foot, ankle or knee, which could cause injury. Since cleats can easily create divots on natural grass, less force is placed on the lower body, which may help prevent injury.
Data for the NFL study came from the analysis of all 1,280 NFL regular season games and 213,935 distinct plays from 2012 through 2016 – 555 of which were on synthetic turf and 725 on natural grass. All 32 NFL teams reported injuries through an electronic health record system, and each injury report gives full details of the injury and circumstance, such as the contact, impact, activity, time lost, game-day weather, and surface type and conditions. The researchers then examined all cases of lower body injuries along two outcomes: any time loss, and greater than eight days of time loss. They also examined the rates of contact-related injuries and noncontact-related injuries, since noncontact injuries are more likely to be related to the playing surface.
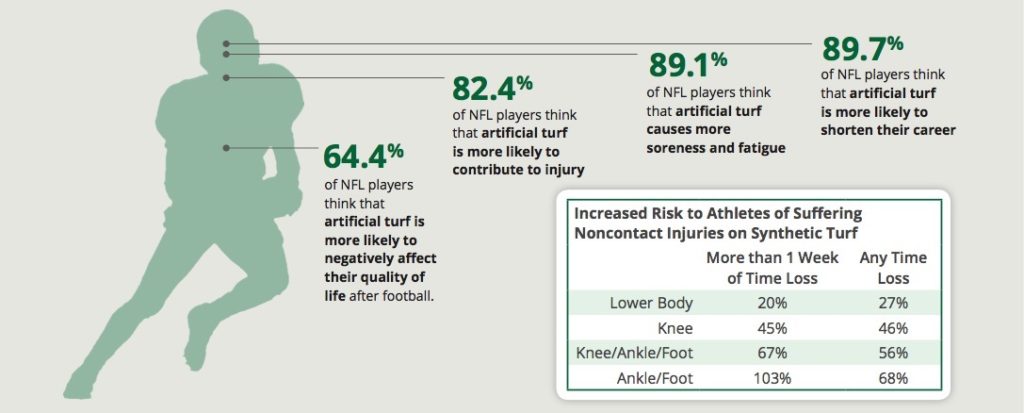
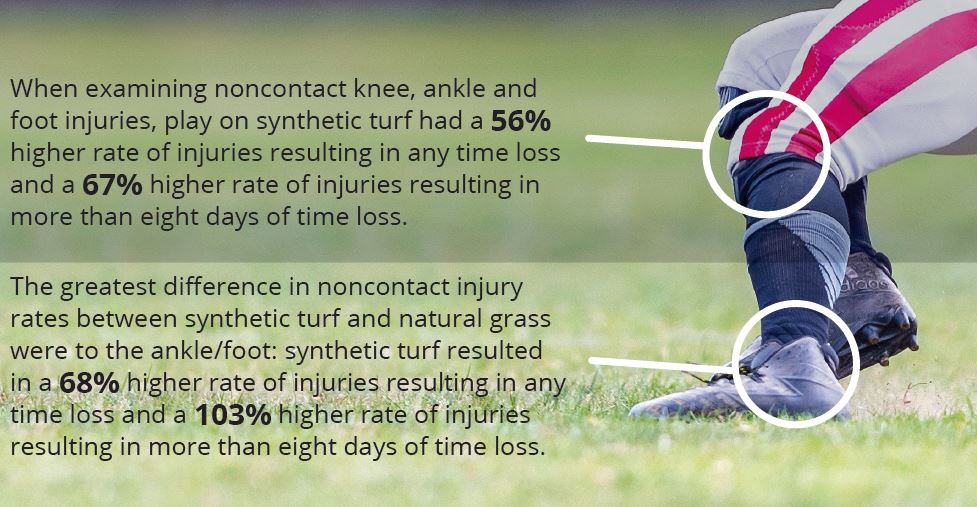
A total of 4,801 lower body injuries occurred from 2012 to 2016 affecting 2,032 players. Play on synthetic turf had a 16 percent higher rate of lower body injuries than on natural grass. This included contact and noncontact that resulted in any time loss. For noncontact injuries, synthetic turf injury rates were 27 percent higher than injury rates on natural grass. However, when examining noncontact knee, ankle and foot injuries, play on synthetic turf had a 56 percent higher rate of injuries resulting in any time loss and a 67 percent higher rate of injuries resulting in more than eight days of time loss. The greatest difference in noncontact injury rates between synthetic and natural turf were to the ankle: synthetic turf resulted in a 68-percent-higher rate of injuries resulting in any time loss and a 103-percent-higher rate of injuries resulting in more than eight days of time loss.
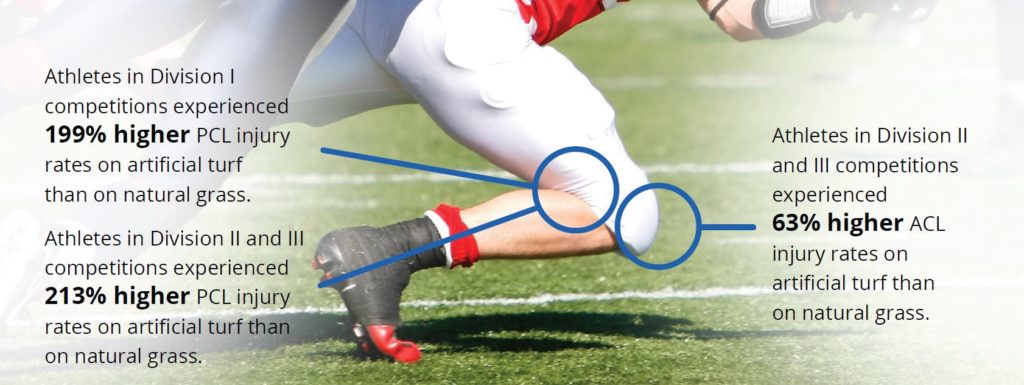
In the NCAA research, there were a total of 3,009,205 athlete exposures and 2,460 knee ligament and meniscal tears reported by the NCAA Injury Surveillance System throughout the 2004-2005 to 2013-2014 NCAA playing seasons. Injury rates for all knee ligament and meniscal tears examined during this period were higher during competitions than in practices. Analysis of this data indicates a significantly increased rate of posterior cruciate ligament (PCL) and anterior cruciate ligament (ACL) on artificial turf compared to natural grass during competitive events, although there were no differences in the rate of medial collateral ligament (MCL), medial meniscal, or lateral meniscal injuries.
Specifically, athletes in Division I competitions experienced PCL tears at 2.99 times the rate on artificial turf (199-percent increase) as they did on natural grass. Division II and III athletes experience ACL tears at 1.63 times the rate of those playing on natural grass and 3.13 times the number of PCL tears as those playing on natural grass. This equates to a 63-percent increase in ACL tears and a 213-percent increase in PCL tears to Division II and III football players on artificial turf. Furthermore, the rate of PCL tears during competition in all divisions on artificial turf was 2.94 times higher (194-percent increase) than on natural grass.
The research and scientific communities will undoubtedly continue to investigate injuries among athletes, causal mechanisms, relationships between cleats and playing surfaces, and more. More information on each of these two studies can be found in the original research manuscripts at the citations below. You can also visit www.TurfgrassSod.org/Resources.
Casey Reynolds, Ph.D., is executive director, Turfgrass Producers International.
Citations
Hershman E, Anderson R, Bergfeld J, et al. An analysis of specific lower extremity injury rates on grass and FieldTurf playing surfaces in National Football League games. The American Journal of Sports Medicine. 2012; 40(10):2200-2205.
Kerr Z, Dompier T, Snook E, et al. National Collegiate Athletic Association Injury Surveillance System: review of methods for 2004-2005 through 2013-2014 data collection. J Athl Train. 2014;49(4):552-560.
Loughran, Galvin J., Vulpis, Christian T., Murphy, Jordan P., Weiner, David A., Svoboda, Steven J. Hinton, Richard Y., and Dave P. Milzman. Incidence of Knee Injuries on Artificial Turf Versus Natural Grass in National Collegiate Athletic Association American Football: 2004-2005 Through 2013-2014 Seasons. The American Journal of Sports Medicine 2019;47(6):1294–1301
Mack C, Hershman E, Anderson R, et al. Higher rates of lower extremity injury on synthetic turf compared with natural turf among National Football League athletes: epidemiologic confirmation of a biomechanical hypothesis. The American Journal of Sports Medicine. 2019;47(1):189-196