By Troy McQuillen
The past 10 years I have been preparing students interested in a turfgrass management career. Students are enrolled in coursework like agronomy, introduction to turfgrass management, mathematics, chemistry and golf or sports turf specific coursework depending upon their interest. While advising and teaching many of these classes within the 2-year program, I discovered a few gaps between their education and their long-term success within the industry.
Most students graduating from the program will finish in 2 years and find entry-level management positions within the industry. Students find during their first few years of employment they are very comfortable with the agronomic principles of managing turfgrass and often excel at irrigation maintenance, disease diagnoses, chemical applications, and even managing small crews. The shortfall comes when a student moves from assistant sports turf manager to head sports turf manager with increased responsibility in managing employees, budgets, capital projects, and equipment. After hearing these similar statements from student alumni, employers, and industry advisors, I thought that it was time to develop coursework and labs experiences that expose students to those responsibilities they might encounter in the job.
The coursework project started as two parts; part one was to develop a realistic facilities/grounds plan that would provide students with some administration experiences. The second part was to create for the first time in Kirkwood’s history a BMPs (best management practices) and master plan for the college’s grounds department.
“Living” lab on campus
Kirkwood was a great place to perform this study. The Vice-President of Facilities and Security was looking for a way to inventory, categorize, develop policy and improve the efficiency of his grounds department on campus. The facilities department accepted our study proposal and we started in January 2015 with the following steps.
First, we needed to determine the actual inventory of property for which the grounds department is responsible. The inventory was broken into categories of hard surface, landscaped, turfgrass, native and finally, agricultural acreage. You might be thinking that we send students out with measuring wheels and walk all the property. No! We used a handy website called www.goilawn.com. This website requires a paid subscription that allows users to look up addresses and calculate square feet from satellite imagery. This was a very helpful resource for determining Kirkwood’s grounds inventory because it could be done from the comfort of your desk. I would recommend this site or similar to sports field managers looking to update their area inventory.
The second step in the process required the most work. The Kirkwood grounds department had never gone through the process of setting up BMPs or even an IPM program. Over the years the grounds department had strategies for mowing and general maintenance but failed to track their labor and inputs into these areas. Our industry in Iowa also is behind in these efforts. The turfgrass industry in our state is just starting to adopt BMPs from other state turfgrass organizations and universities for their maintenance plans. The Kirkwood students researched many BMP templates and at the conclusion decided to adopt several BMPs for each maintenance priority but also add additional details that best represented our facilities.
While developing the BMPs we also started prioritizing our grounds maintenance areas. We felt it was important to have maintenance priorities for budgeting and logistic purposes. Here is the list of our priorities including a few basic BMP standards that fit our grounds situation:
- Priority A [START BOLD]enhanced[END BOLD] (athletic surfaces, campus home, hotel)
- Mowing to occur 2-3 times per week following the 1/3 rule
- Maintain a minimum of 95% turf cover
- No more than 3% weed infestation
- Perform regular cultivating practices to prevent excessive compaction
- Priority B [START BOLD]improved[END BOLD] (general lawns and grounds)
- Mowing to occur once weekly with the 1/3 rule
- 88% turf cover
- No more than 10% weed infestation
- Aerate only in heavy compacted areas
- Fertilizer to be applied twice per year based on soil testing
- Priority C [START BOLD]semi-improved[END BOLD] (no-mow, fescue areas)
- Mowing to occur annually to control weed populations
- Controlled burning based on recommendations
- 75% vegetative cover
- Safety Hazard Maintenance
- Priority D [START BOLD]unimproved[END BOLD] (wildlife area and agriculture property)
- Maintain areas to Iowa DNR natural habitat standards
In addition to these broad BMPs we also included specific procedures for areas of mowing, fertilization, cultivation, pest control and irrigation.
After all the background work of inventory and standards were completed it was time to implement and collect data for the cost analysis. We decided as an organization to track the maintenance from each category and assign a cost per acre for those priorities. We focused the cost centers on labor, materials, and contracted services.
One method of data collection was a daily log for each employee to fill out at the end of their day’s activities. Just like anything new it was difficult at first getting employees to buy into the daily log but we had the back up of administration to enforce our efforts. Employees had to record the time it took to perform the actual task and a list of any products or materials used. My recommendation is to keep this simple by creating a three ring binder with separate sheets for each day of maintenance or using a task manager app.
In addition to the daily logs I would also recommend adding soil sample analysis from designated areas, double checking and documenting your equipment calibrations, discussing product options with manufacturer reps, and collecting irrigation details or audits from sites with automated systems. Going through each of these items in addition to creating Excel spreadsheets for the information will be helpful in assembling your final report. I would also stress that there is no need to recreate the wheel on a project of this size. Many people in our industry have data collection spreadsheets that they would be willing to share.
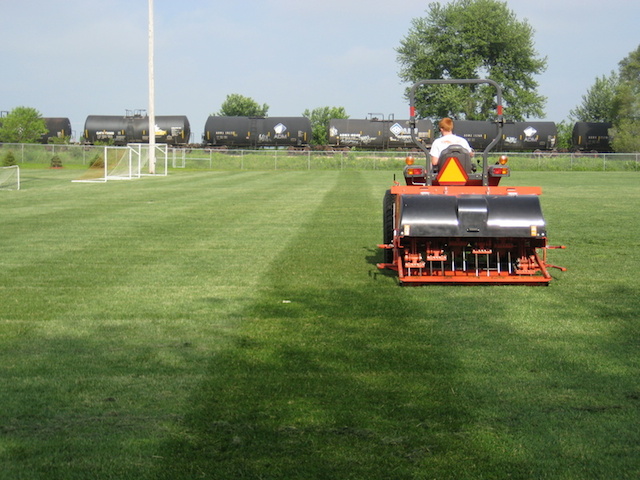
This past 2015 growing season was our first chance to put actual cost with our maintenance priorities. We started with tracking our enhanced priority intramural athletic field (90,000 sq. ft.). Mowing was the first BMP studied. We started with a mowing goal of maintaining the 1/3 rule throughout the growing season, spending more time on maintenance of our rotary mower blades and raising our mowing heights during the sports off-season. We documented at total of 61 mowing and mower maintenance occasions with an average cutting height of 2 inches. This totaled 184 part-time labor hours at a cost of $1886. Almost 94% of our mowing was done with part-time seasonal employees.
The second BMP was fertility. This included a more in-depth soil analysis to decide what nutrients were currently in the soils and what was available to the plant. With all of our athletic surfaces being native soil based, we developed an agronomy plan to include between 3.5-4.0 lbs. of N/1000 sq. ft. The season maintenance plan was to use granulated slow release nitrogen sources but also include liquid fertilizer and biostimulants. The granular application cost for labor and materials for the season was $676. The cost for the liquid nitrogen, calcium and biostimulant package for labor and materials was $1734. We had a lot of success with this combination of fertilizer this season and will keep on the same program for next year.
The third BMP was cultivation. This included both hollow and solid deep tine aerations. With the lack of equipment resources we contracted deep-tine aeration and light topdressing at $1200. We also borrowed a newer core aeration machine for the local golf course in the Fall that had a cost of $65.50 in labor. Most of our cultivation practices were followed by a light sand topdressing and overseeding with a material and labor cost of $2479.
The forth BMP evaluated was the important pest management strategies. This budget item was important for us to follow the IPM standards set by the facilities department. With the athletic field areas being Priority A, our pest threshold levels were much lower than average around campus but needed to maintain a consistent safe playing surface. We identified a lot of our pest problem before developing the budget and pest management program. Our main issues were leaf spot on the ryegrass, dollar spot and a few localized grubs on the northern half of the field. With these challenges and the favorable season temperatures our pesticide and labor total was $696. Most of this cost included preventative leaf spot and dollar spot controls along with spot treatments for grub damage.
The last of our BMP’s was the Irrigation. The system for our athletic fields was well water, so we did not have any actual water cost with irrigation but did have a BMP to improve our system’s efficiency. The first irrigation audit back in 2014 had a distribution uniformity of 60%. Many of our issues were dynamic PSI and nozzles. The repairs included PSI regulation at the valve, pump modifications, nozzle changes, and a few full head replacements. Our cost for the past season was a little more than expected at a labor and materials rate of $1105. We did not get a chance this Fall to redo an irrigation audit but is on the schedule for this Spring.
To finalize our seasons cost, we also included additional labor and materials line items like fuel and paint. We determined as a college that our priority A cost was between $.20 and .24 cents per square foot.
In conclusion, this project has provided the grounds department and administration with some valuable decision making information when it comes to how campus grounds priorities are maintained. With this past 2015 growing season we have calculated cost per acre for all priorities. In the future we hope to look at seasonal averages and also begin to forecast the required maintenance for new infrastructure. We are off to a good start but still finding ways to implement all of the written BMPs and other strategies for tracking data.
Troy McQuillen is assistant professor of turfgrass management at Kirkwood Community College, Cedar Rapids, IA.